
What we learned about our community

A volunteer team at a previous project weekend
At the end of last year, we tasked the community with an exploratory project from our internal data: analysing the data they had submitted about themselves when applying to volunteer. You can learn about the project structure in our blog Building Impact With Care.
We asked them to answer a variety of different questions using whatever tools and analysis techniques they preferred, and provide us with some feedback and recommendations based on that analysis. And here is what they told us!
How well is the application process working?
Last year, we received an incredible 371 applications to join our volunteer community. Overall, 74% of the total number of applicants completed the full process, with 12% dropping off after being invited to complete training, and only 9% not being eligible to volunteer.
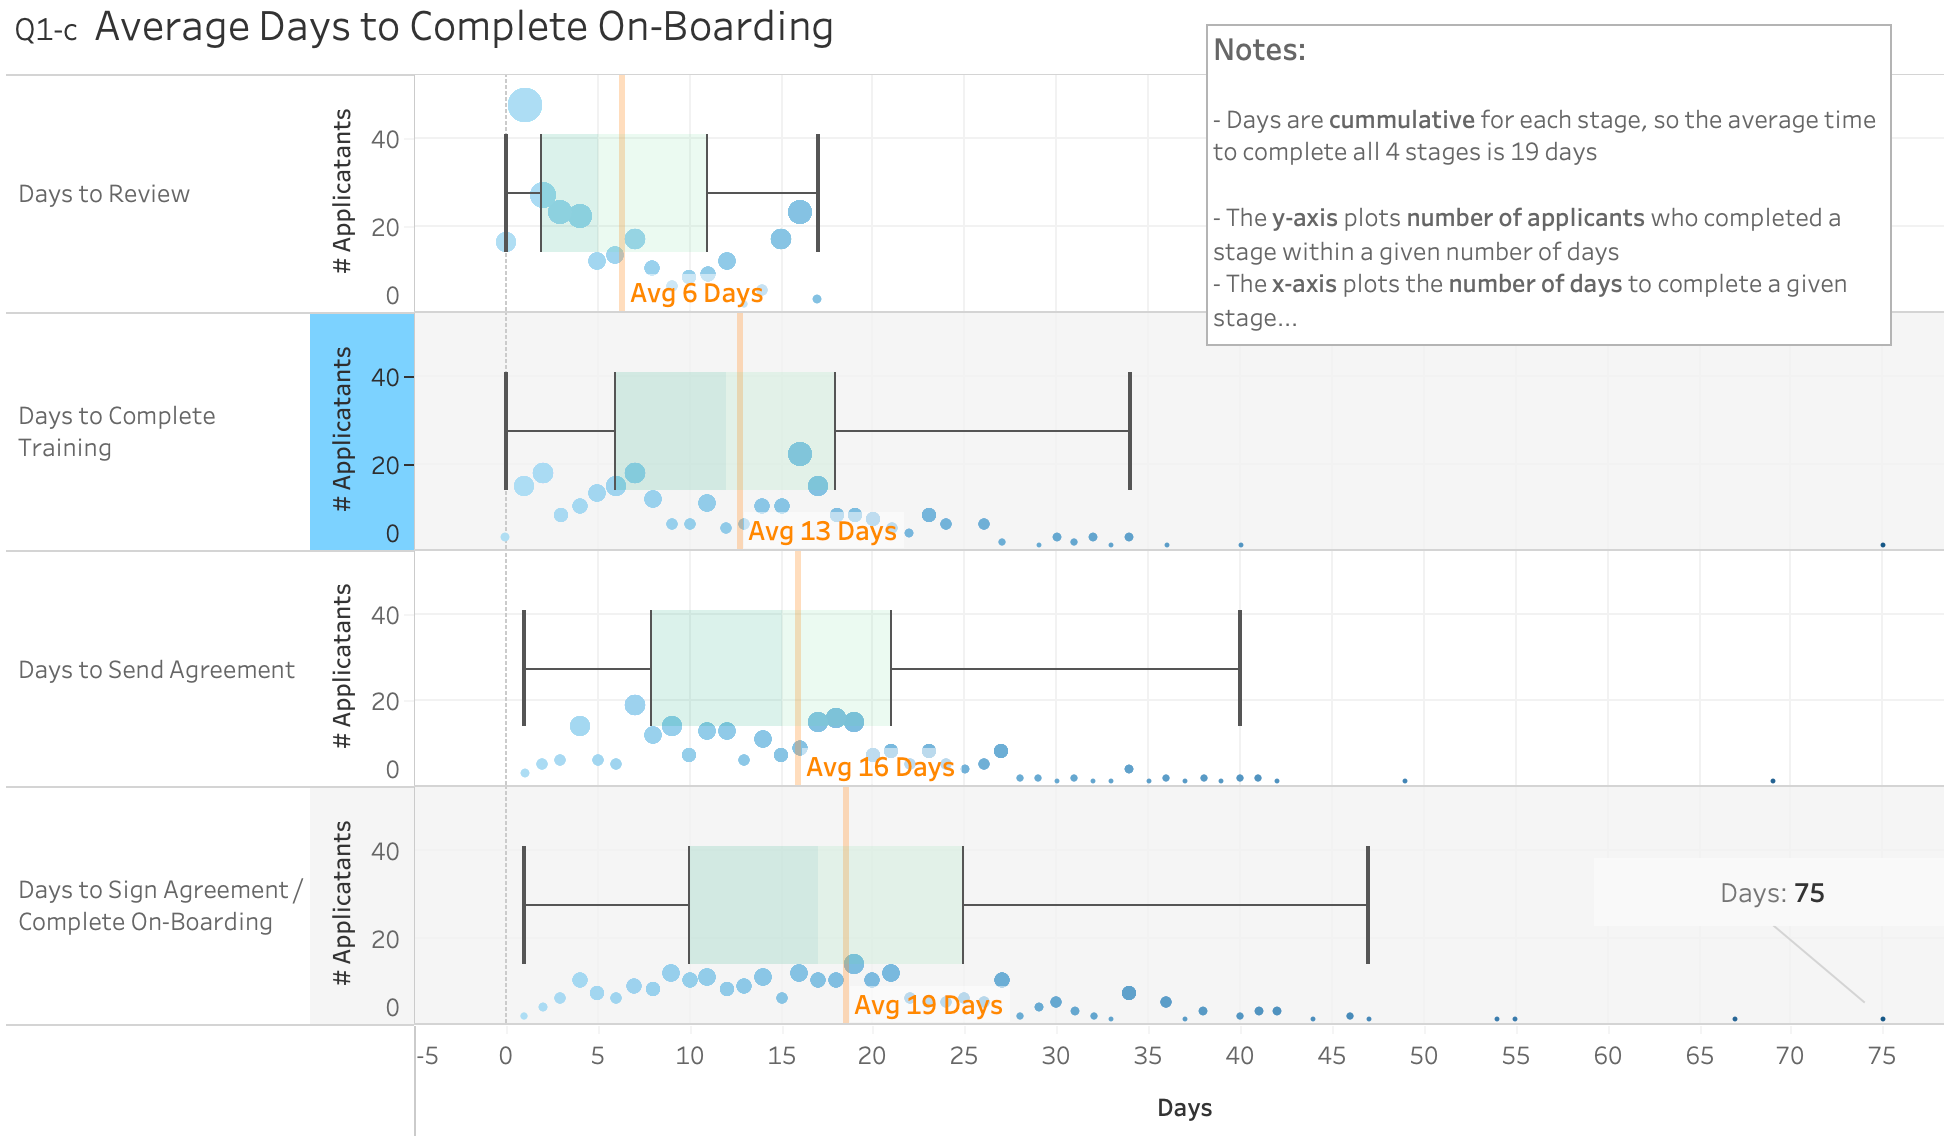
Average days to complete onboarding
It took, on average, 19 days for applicants to complete onboarding. This seems like a very reasonable turnaround for a skilled volunteering process, especially as key aspects such as initial application reviews and sending out agreements are currently done manually. The award for ‘longest lag’ goes to a volunteer who took 69 days in total to complete their onboarding.
A breakdown of how long each stage took on average helps us understand where we could improve or change how the onboarding process works. For instance, we might look at how difficult or accessible the ‘training stage’ is if we want to reduce the length of time it takes to complete.
The current number of drop-offs is not a concern, but we could check if it needs to be improved by doing a wider evaluation of whether current demand for volunteers is met by the number of successful candidates, or if we might be losing people with crucial skills during the onboarding process. For instance, checking how many people open the form but don’t complete it.
What skills does our community have?
When they apply, potential volunteers self-rate their key skills to help us match them with suitable projects. Within our community, the most common skills are general data analysis, Exploratory Data Analysis (EDA), data visualisation, and data cleaning. People with good ratings in one of these skills tended to rate themselves highly across the others too, which makes sense, as most of them would be part of a standard data analyst skill set.
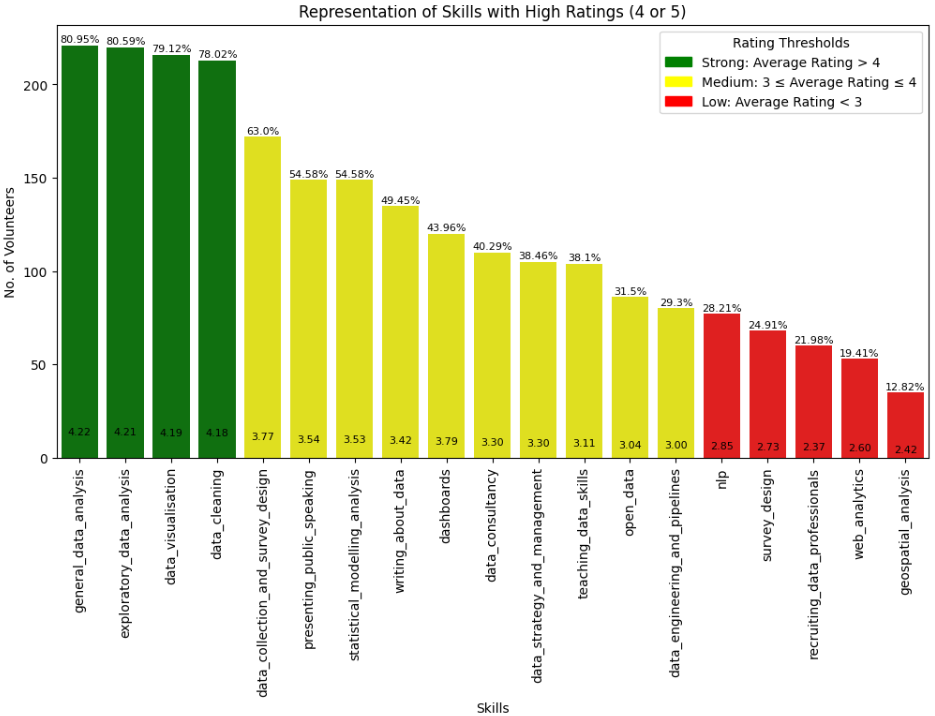
Representation of skills with high ratings
Skills with the lowest representation included NLP, survey design, recruitment, web analytics, and geospatial analysis, and these also showed lower correlation with other skill sets.
As all of the skills ratings are self-reported, there might be some over- or underestimation. Ratings may also not reflect current skill levels, as volunteers could have gained experience since their last update. It would be helpful to build in ways to let volunteers update their skills as they develop, such as annual surveys, or other ways to access and update their information.
We can also hone the skills options on our form to eliminate unnecessary overlap, such as between exploratory and general data analysis. We have more work to do to confirm whether the review and acceptance of candidates meets expectations for the level of skill we need.
Which types of roles are volunteers most interested in?
We also compared what skills people have against the kinds of volunteering they want to do. Most applicants are interested in ‘hands-on’ roles with third sector organisations, and doing data cleaning or ETL (Extract, Transform, Load) work, and those people also rated themselves highly in general data analysis skills. There is also an appetite for project scoping, which is currently done by DataKind UK staff, and is being piloted as volunteer training at the moment.
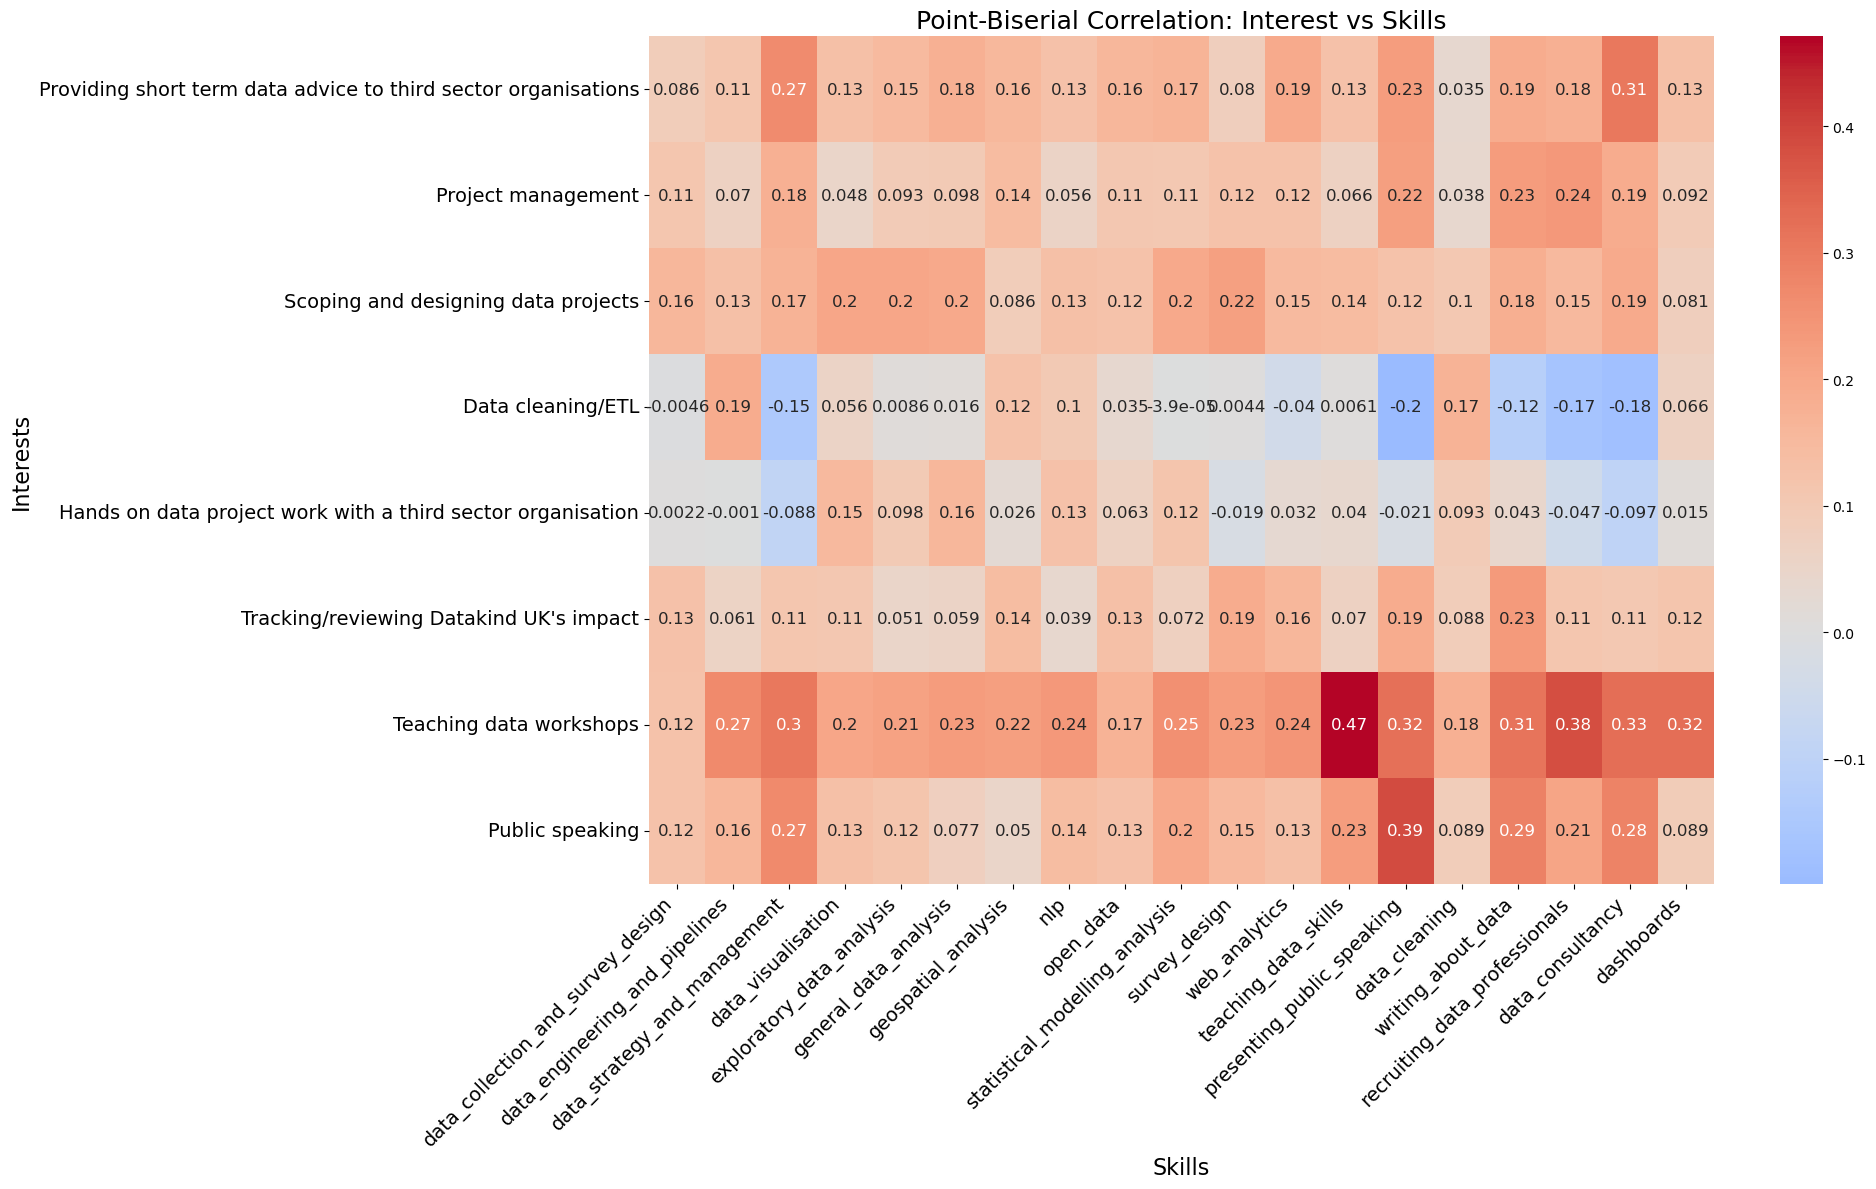
Correlation of interests vs skills
Although public speaking and teaching are less popular across the board, regardless of time commitment, the strongest skill to interest correlation was between teaching and those with teaching skills. Some people marked themselves as keen to take part in activities that they didn’t rate themselves as skilled in, suggesting areas they would like to improve on.
Skills and interests could also be clustered, with four possible ‘sets’ emerging:
Data strategy, management and engineering fans have skills in data pipelines, strategy, consultancy, and recruiting.
Analytics and business intelligence types like data cleaning, dashboards, analysis, and visualisation.
Survey and data literacy folks have experience with survey design, teaching, and presenting, and can support us with communication.
Advanced and open data methods volunteers are skilled at NLP, open data, web analytics, geospatial, and statistics, and are keen to work on advanced analysis methods and open data.
What can we find out about volunteers’ professional backgrounds and levels of experience?
We ask volunteers for their current job title, so looking at this data could give us a real snapshot of our talent pool. Sadly, this became the trickiest of the four questions because the form field is free text, so the data quality was highly varied and it was hard to see meaningful results.
However, it isn't a big surprise that roughly 40% of our volunteer pool are Data Analysts or Data Scientists. Management, Leadership, Support, and Administrative roles make up 15% of our volunteers. Importantly for long-term sustainability, students and entry-level professionals account for 11% of our volunteers.
Unfortunately, we don't actually know the experience level of most of our volunteers. When we analysed seniority using job titles, we found 61% of our volunteers fell into an 'unknown or unclassifiable' category. Early career professionals make up 21% of our known volunteers. A small percentage (3%) hold Executive, C-Suite, or Senior Leadership positions, indicating they have more experience or seniority in their field.
When looking at our volunteers’ experience, we have pockets of expertise and clear emerging talent, but a massive blind spot in the middle. This has implications for how we deploy people, mentor them, and build projects. We're missing crucial data that would let us say: 'This volunteer is ready to lead a project. This one needs mentoring. This one is exploring a new field.'
Getting a cleaner dataset and context about seniority by using more fixed data, such as job role categories and years of experience, could be an important part of how we match people to the right opportunities and offer meaningful development in future.
Where are our volunteers based?
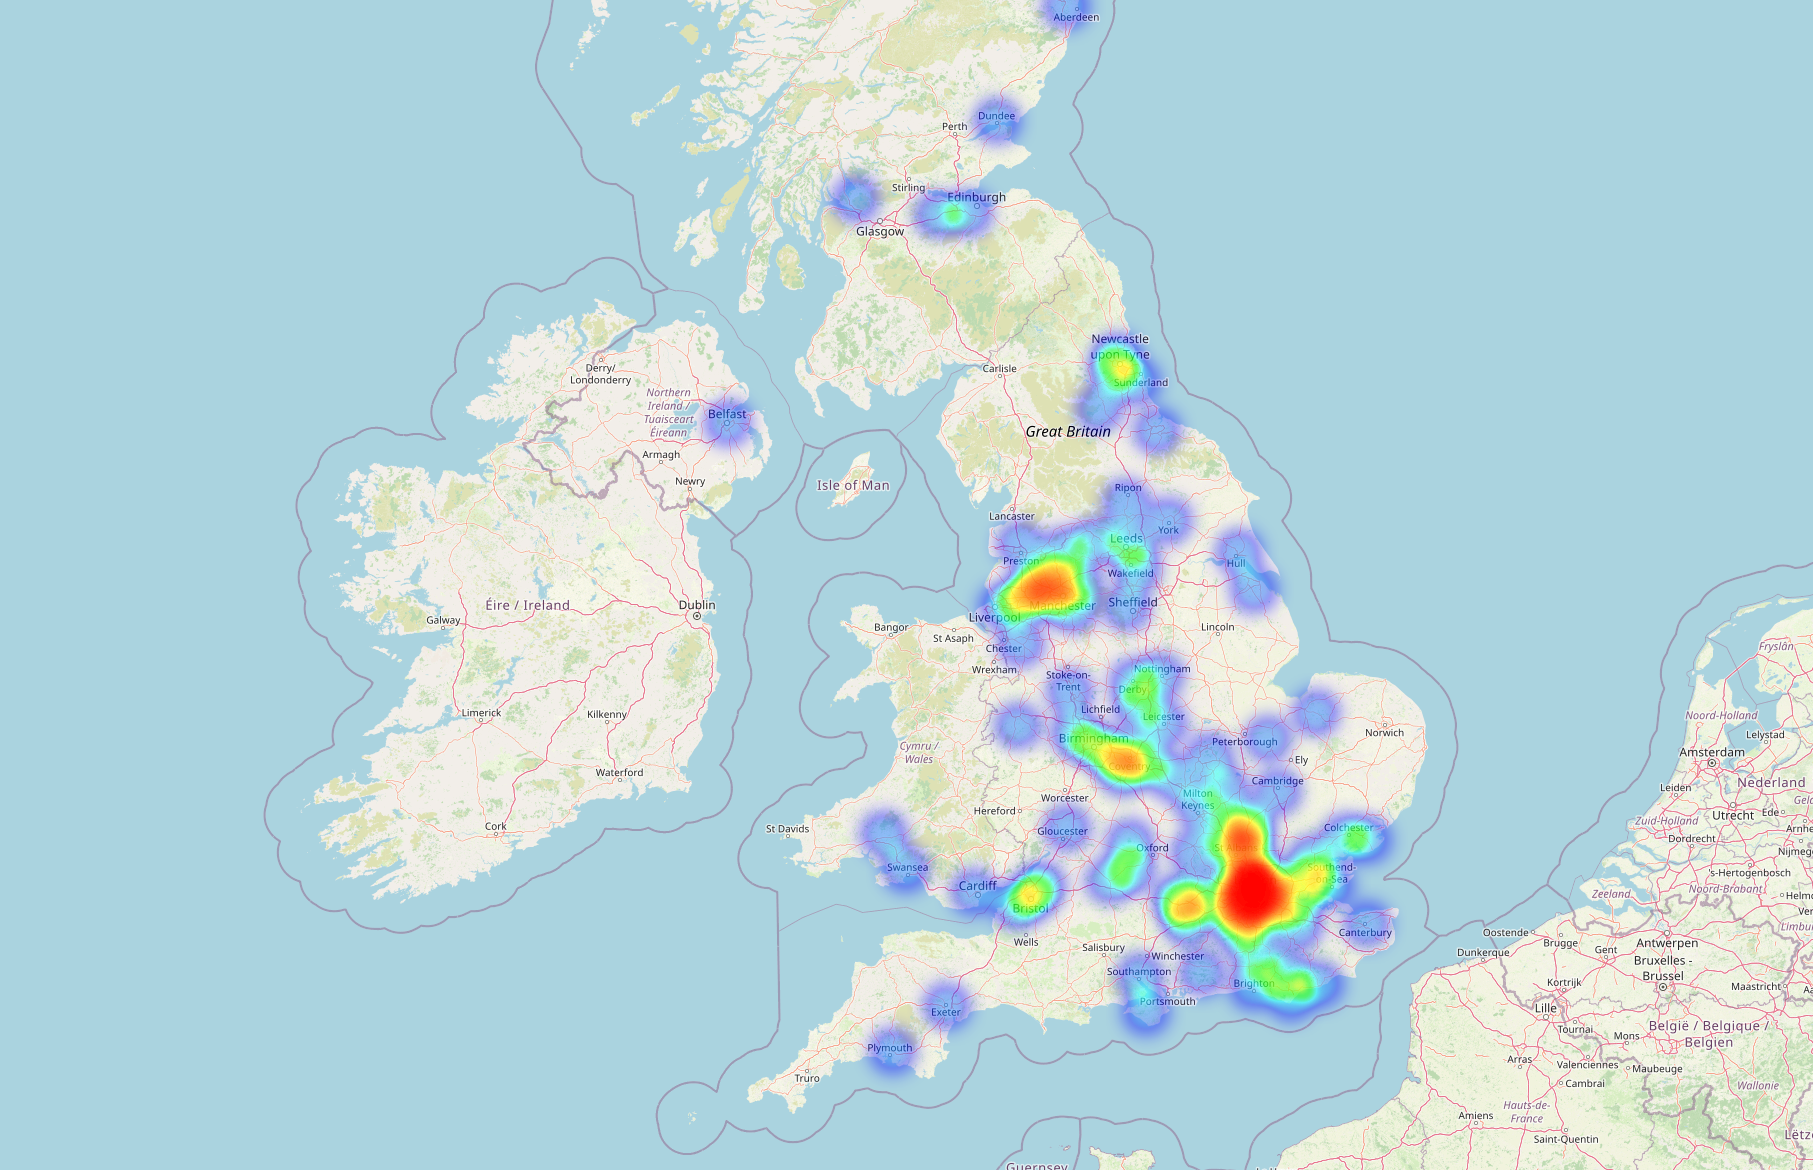
Heatmap of volunteer locations
Volunteers provide their addresses so that we can plan regional meet ups and place-based projects. Heat maps and counts by region show a broad spread of people across the UK, with London dominating.
The next highest groupings of volunteers after London can be found in Salford, Edinburgh, Kingston upon Hull, Birmingham, and Coventry - but these numbers are all in the single digits.
Because of this, our ‘remote first’ approach remains the best option for our opportunities and roles, while London is still dominant enough to be our base for any in-person gatherings.
It may be difficult to improve address data collection, as it relies on individuals filling in the form fields consistently.
We’ve also run a survey to ask volunteers what kinds of events they want to attend, and how likely they would be to travel for one, so we’ve got evidence that informs this mapping a bit further.
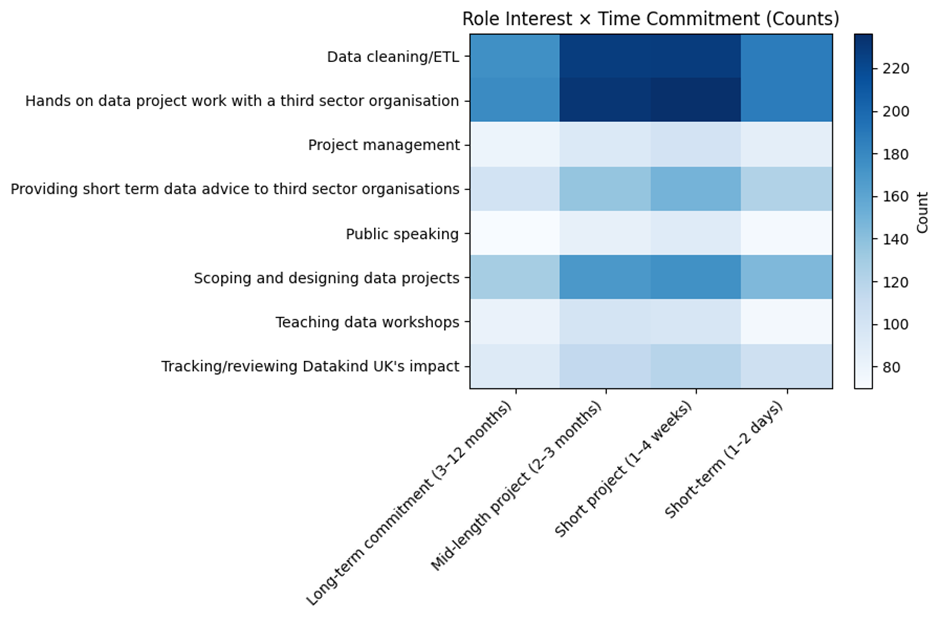
Role interests vs preferred time commitment
What availability does our volunteer pool have?
The strongest amount of interest was in short-term (1-4 weeks) and mid-length (2-3 months) projects, suggesting that most volunteers prefer flexible, time-bound opportunities. But, there is interest in both very short and long-term commitments too, so we have a lot of flexibility!
In the future
To help us define what success looks like in future, we can look at how well the application form aligns with our project pipeline and support needs. What kind of volunteers are we looking to attract, and what does a good application process look like? Where are there gaps in need, and does the skill set of the community meet them, or do we need to change how we find and recruit candidates? Is it possible to match the application form questions as closely as possible to what we use to assign people to projects?
For example, geospatial skills are rare, but we’ve seen that they are often useful for third sector projects. We can try to develop these skills in our existing volunteers, and target it in our recruitment to build the overall number of community members with that skill area. And, we can look at how to balance the technical side of our community with ‘softer’ skills such as teaching.
We can also assess demand by volume and timing (what skills are needed at which point in time, and how many) so we can be more specific about different roles, for example short and medium-term projects across flexible hours, evenings, and weekends. We could redefine demand requirements in terms of skills, availability, project duration, or timing, ensuring the future availability of candidates matched incoming demand. Creating an even more rigorous sign up process might cause higher rates of attrition, but build a more committed and curated pool of volunteers.
Once we have a clearer overall picture, we can improve how we communicate to our current and potential volunteers, and continue to build a strong, impactful community.
Huge thanks to all the volunteers who ran analyses and presented their data!
